


-

Participate in the Dekho Apna Desh People’s Choice Poll
-

NIC Driving the Digital Transformation
-

Digital Agriculture Platforms
-

Next-gen Fin-tech Solutions
-

Health-Tech Innovative Solutions
-

Empowering the future of education with Edu-tech Solutions
About us

National Informatics Centre (NIC) is a premier Information Technology organization in India committed to providing state-of-the-art solutions for the IT needs of the Government of India at all levels. NIC carries the distinction of being the largest IT Organization in the Country and has set up a satellite based nationwide communication network called NICNET having over 1400 nodes connecting the National Capital, the State Capitals and the District Headquarters to one another. The IT services of NIC range from Consultancy, Software Design & Development, Office Automation and Networking Services to Training, Video Conferencing, CAD, EDI, Multimedia and Internet Services including Web Site Development and Hosting. NIC has a nationwide presence with its offices spread all across the Country, from Leh to Andaman & Nicobar Islands. Since its inception in 1993,…
Events

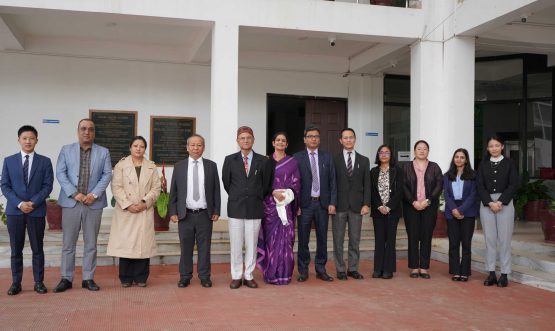
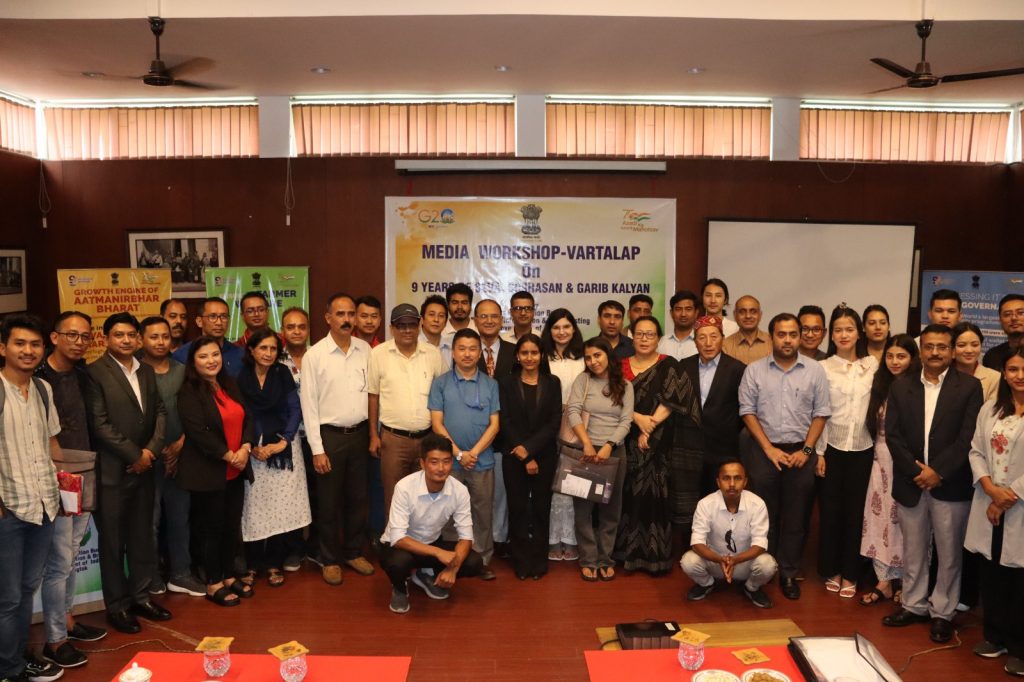
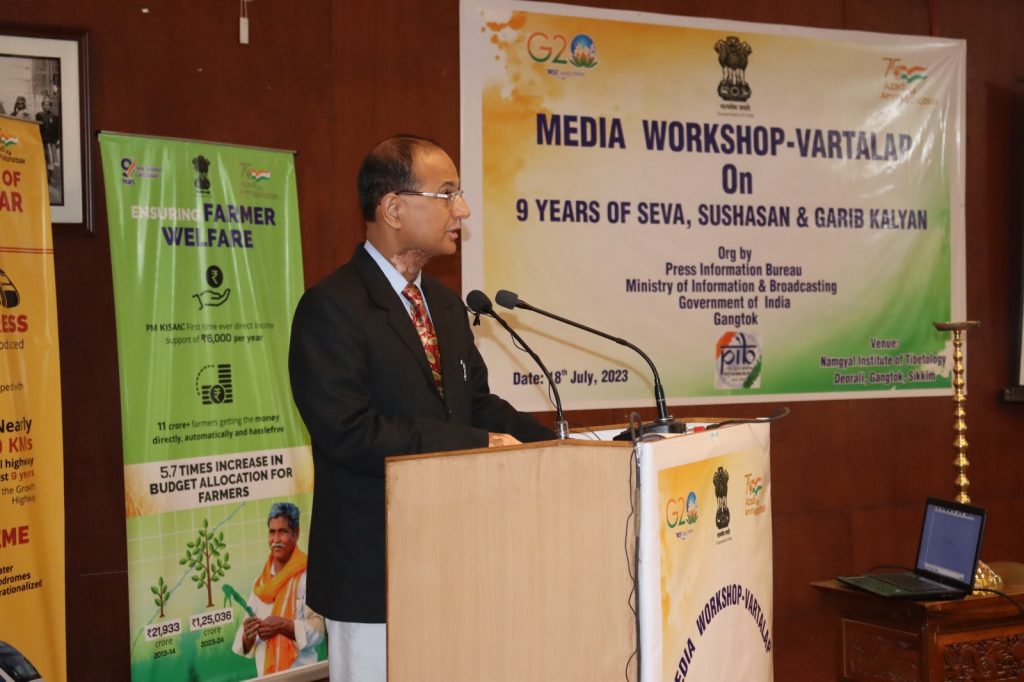
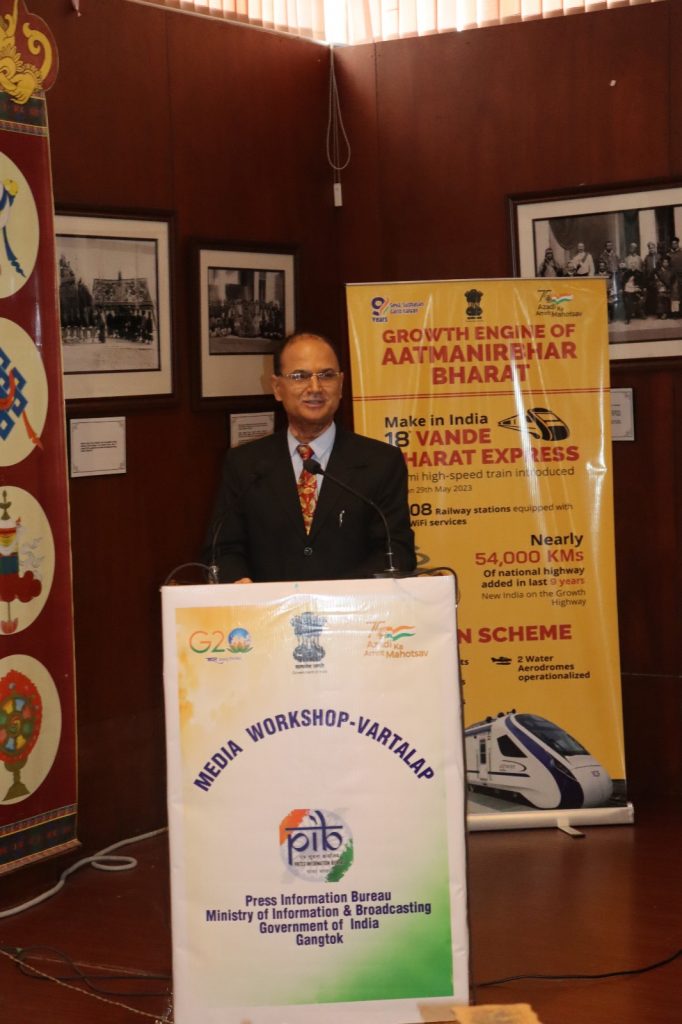
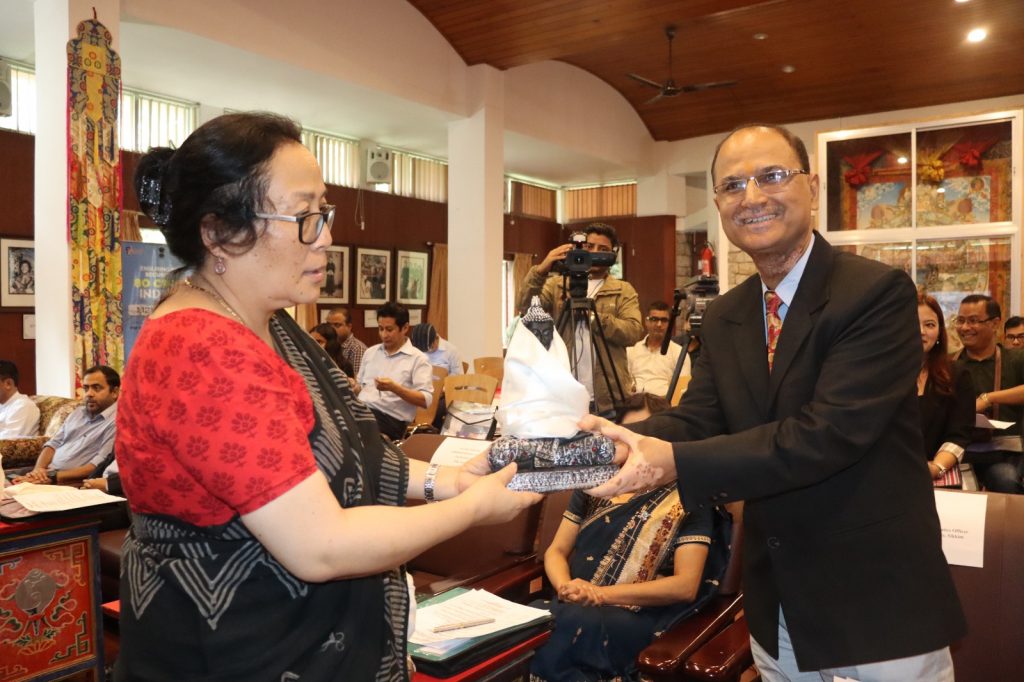
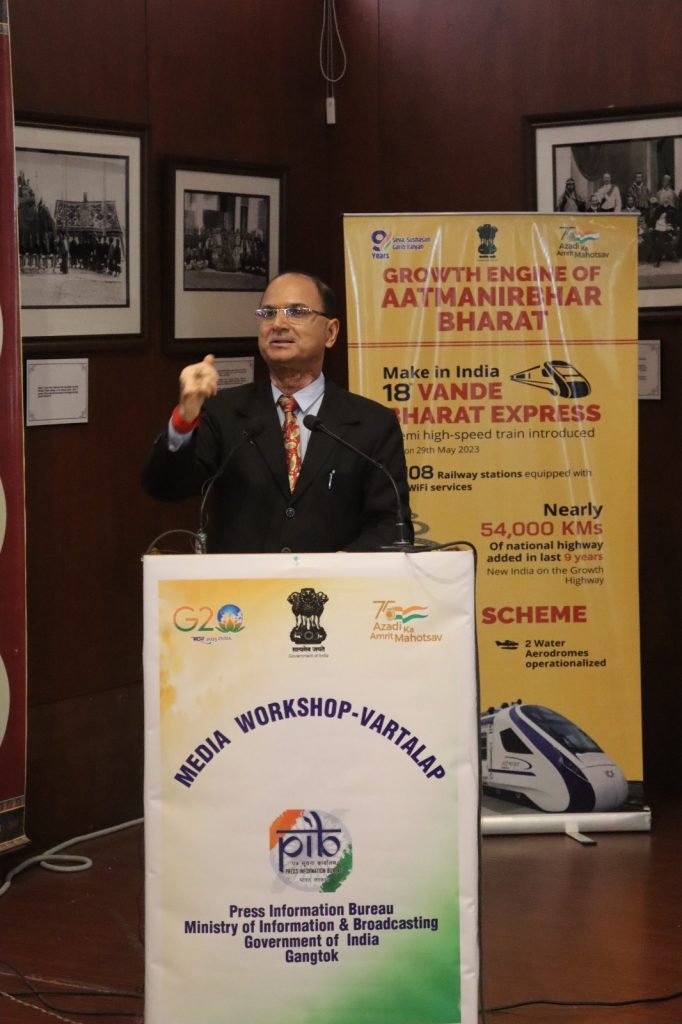
SIO Sikkim Addressed Media Workshop – Vartalap
SIO Sikkim Addressed Media Workshop – Vartalap On 18th July 2023, “Media Workshop – Vartalap” was organized by Press Information…
Awards
Sorry, we could't found any records.
Photo Gallery
National Informatics Centre Sikkim
Tashiling Secretariat,
Gangtok, PIN 737103
Sikkim